A Good Forecast Is Often Wrong
A confidence score is meaningless unless it is calibrated. What weather forecasting learned about honest probabilities, and why modern neural networks forgot it.
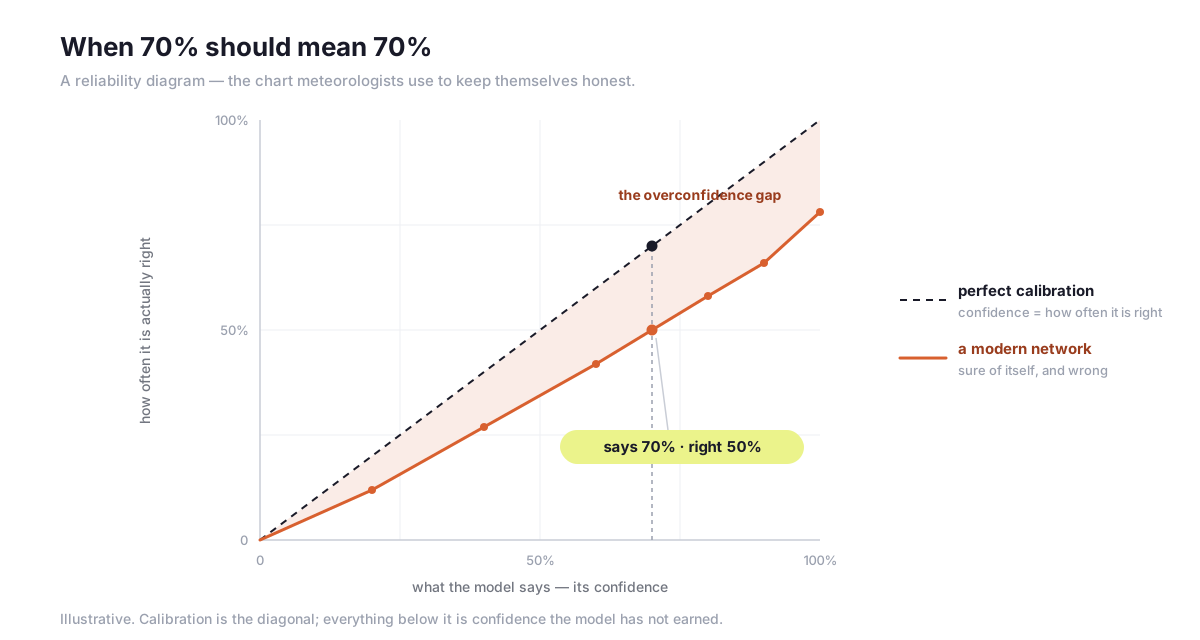
Model calibration, also called confidence calibration, is the property of a predictive model whose confidence scores tell the truth about how often it is right: among all the cases it labels with seventy per cent confidence, it should be correct on about seventy per cent of them.
A forecaster on the evening news says there is a seventy per cent chance of rain tomorrow, and then it stays dry all day.
Most people file that under “the weather was wrong again”. The meteorologist files it under Tuesday. A seventy per cent forecast is not a promise that it will rain. It is a promise that, across all the days on which she says seventy per cent, it will rain on about seventy of every hundred of them, and stay dry on the other thirty. The dry day was not a failure of the forecast. The dry day was, statistically, included.
This is the strangest and most useful idea in all of prediction, and it took meteorology decades to learn. A good forecast is allowed to be wrong. In fact a good forecast must be wrong a precise fraction of the time, or it was never honest to begin with.
I keep coming back to this whenever someone shows me a model that is ninety-nine per cent sure.
Is a confidence score a promise or a feeling?
We have a name for the property the weather forecaster has and most software does not. It is calibration, and it is brutally simple to state.
A confidence score is calibrated if it tells the truth about how often it is right. Among all the times a system says “seventy per cent”, it should be correct about seventy per cent of the time. The textbook version is identical: scikit-learn defines a well-calibrated classifier as one where, among the cases it scores around 0.8, roughly eighty per cent actually belong to the class. The number on the screen is not a mood. It is a claim about frequency, and like any claim it can be checked.
Meteorologists check it with a picture called a reliability diagram. You take every forecast you ever made, sort them into buckets (the twenty per cent forecasts, the thirty per cent forecasts, and so on), and for each bucket you ask what actually happened. Then you plot the promise against the outcome. The Met Office puts it plainly: for perfect reliability the forecast probability and the observed frequency are equal, and the points lie on the diagonal. Say twenty-five per cent, and on a quarter of those occasions it should rain. The diagonal is honesty drawn as a line.
What is quietly remarkable is that real weather forecasts pass this test. Murphy and Winkler, studying operational American forecasts in 1977, found that forecasters can in fact formulate probability forecasts in a reliable manner. Three decades later Bickel and Kim verified 169,163 Weather Channel rain forecasts across forty-two locations and found probabilities between 0.4 and 0.9 well calibrated for the near term. When the Weather Channel said sixty per cent, something close to sixty per cent of the time, it rained.
A confidence number that survives that test is worth something. A confidence number nobody ever plotted is worth nothing at all.
The honesty has edges
I want to be careful here, because the weather is also a lesson in where calibration breaks.
The same Bickel and Kim study found that the forecasts went off at the extremes: probabilities below 0.3 and above 0.9 were not well calibrated, and anything beyond a six-day horizon drifted into noise and started superstitiously avoiding 0.5. There is even a documented “wet bias” in the field’s history, a stretch when a twenty per cent chance of rain on the Weather Channel meant it actually rained only about five per cent of the time. The forecasters were leaning their low numbers upward, on the theory that nobody complains about an umbrella they did not need.
Calibration is no halo. It holds in the middle and frays at the tails. It holds for tomorrow and dissolves by next week. The honest claim is never “this system is calibrated” full stop; it is “this system is calibrated here, in this range, under these conditions, and I have the diagram to show you where it stops”. Hold that thought. It is the whole engineering job, and computer vision learned it the hard way.
Why do modern neural networks forget how to doubt?
Here is the part that should unsettle anyone shipping a model.
In 2017 four researchers at Cornell, Chuan Guo, Geoff Pleiss, Yu Sun and Kilian Weinberger, published a paper at the International Conference on Machine Learning with a deceptively dull title, On Calibration of Modern Neural Networks. Their finding was not dull at all. Modern neural networks, they showed, are no longer well calibrated, unlike the networks of a decade earlier. The machines had become more accurate and, at the same time, more dishonest.
Their illustration is the one I cannot forget. They took a five-layer LeNet, the venerable design from LeCun and colleagues in 1998, and set it beside a hundred-and-ten-layer ResNet from 2016, both on the same CIFAR-100 images. The old network was the less accurate of the two: it got 44.9 per cent of images wrong, against the ResNet’s 30.6. But the old network was honest. Its average confidence closely matched its accuracy. The modern ResNet was the better classifier and the worse witness. Its confidence ran substantially higher than its accuracy: a machine that had learned to be right more often and to oversell every answer regardless.
Then they found the culprits, and this is the genuinely uncomfortable bit. The very ingredients that made networks better made them worse calibrated. Greater depth and greater width cut the error rate and pushed miscalibration up with it. Batch Normalisation, a near-universal trick that improves accuracy, left models more miscalibrated rather than less. Less weight decay, the loosening of an old regulariser, hurt calibration too; in fact calibration kept improving as they added regularisation back, well past the point where accuracy had stopped caring. Every lever the field pulled to climb the leaderboard was, as a side effect, teaching the model to exaggerate.
You can measure the exaggeration with a single number, Expected Calibration Error: the average gap between what a model promises and what it delivers. That same ResNet on CIFAR-100 had an ECE of 16.53%. Sixteen points of pure overconfidence, baked into a network that looked, by its accuracy, like a triumph.
Does a confident model mean a correct one?
If leaderboard worship had any defence, it was the quiet assumption that a confident model is usually a right one. The evidence dismantles it.
Three years before the calibration paper, Anh Nguyen, Jason Yosinski and Jeff Clune showed something that still reads like a magic trick gone wrong. At the 2015 computer-vision conference they demonstrated that you can produce images completely unrecognisable to a human (television static, abstract noise) and a leading network will label them as familiar objects with 99.99% confidence. It will look at white noise and declare, with near-certainty, that it is a lion. The number on the screen said certain. The screen contained nothing at all.
The same crack shows up in tamer settings. Hendrycks and Gimpel, in a 2017 paper that became a standard reference, pointed out that you can lean on the softmax score as a rough alarm: correctly classified inputs do tend to carry higher maximum probabilities than the misclassified and the genuinely out-of-distribution ones. Useful, and also a quiet admission. If you need the confidence score to flag the cases the model is about to get wrong, you have already conceded that the score and the truth are two different things. Confidence is a witness, not a verdict.
This is why the corrective matters so much. A confidence score is not a measure of correctness. It is a claim about correctness, and an unaudited claim from an overconfident witness is not evidence. It is just a number that feels like one.
Calibration put to work
At digiLab we have spent years putting numbers on doubt; our co-founder, Tim Dodwell, is a professor of uncertainty quantification, and the habit runs through everything we build. VisionEngine is what that habit looks like pointed at computer vision, and the relevant part here is what it does with a model’s confidence.
When it labels your images with an open-vocabulary baseline, it does not hand you a wall of predictions and wish you luck. It ranks them by the model’s own uncertainty and walks you to the calls it is least sure about, the thin hesitant band where the score is neither a clean yes nor a clean no. You accept, reject, or fix those. That is the moment calibration stops being a diagram in a paper and becomes a decision you act on: trust the confident middle, and spend your scarce human attention exactly where the doubt lives. It is the same instinct that decides where attention should go in a labelling queue. You do not inspect everything. You inspect the uncertain.
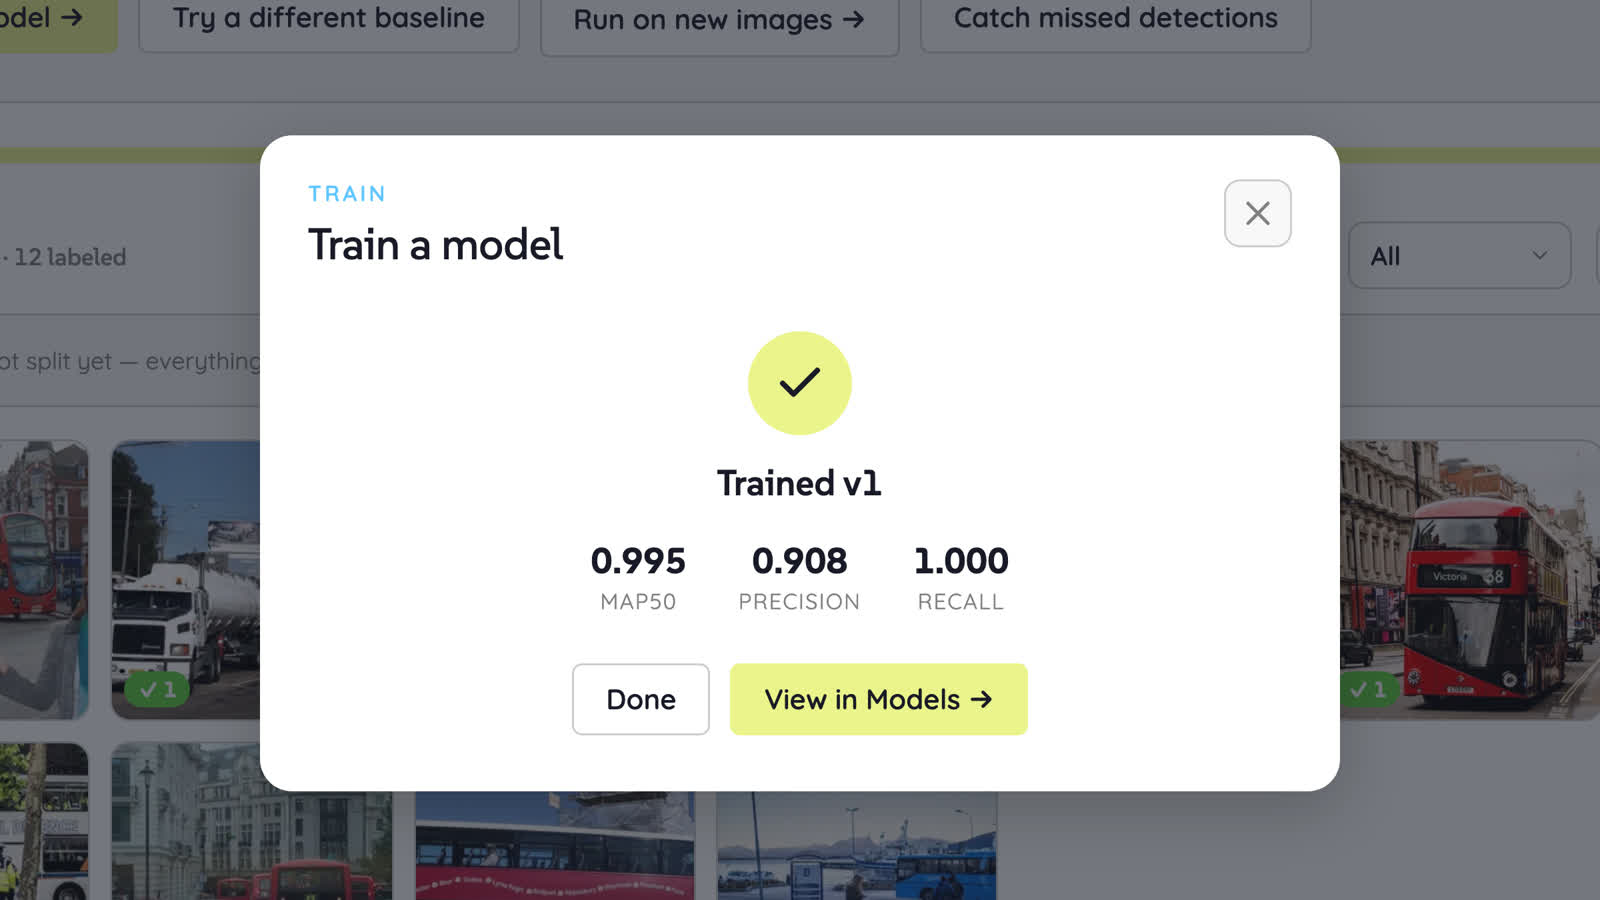
And because the model never stops being a witness whose claims need checking, every trained version reports its measured numbers against the baseline (mAP50, precision, recall) so the improvement is something you can see rather than something we assert. In one recorded run, twelve street photographs of one class trained for ten epochs, the loop took roughly two minutes of human attention and the model scored mAP50 0.995 on its held-out split. I will be honest about that figure, the way a forecaster is honest about a dry Tuesday: twelve photos of buses is a small, easy problem, and the score proves nothing about your defects or your tumours. The height of the number is never the point. The point is that you measured it.
Earning the diagonal
So what does this ask of anyone building with these models? That we stop chasing a single higher number and start earning a trustworthy one.
The fix, mercifully, is often cheap. Guo and colleagues showed that a method called temperature scaling is surprisingly effective at restoring calibration. It quietly divides the network’s outputs by one learned number before the final step, a single-parameter descendant of Platt scaling. It can be written in about two lines and runs in a millisecond, and crucially it leaves accuracy untouched, because it never changes which answer wins, only how loudly the model asserts it. On that badly miscalibrated ResNet it pulled the Expected Calibration Error from 16.53% down to 1.26%. Same accuracy. A model that had learned, finally, to mean what it said.
But the discipline does not end with one clever transform, and this is where the weather’s hard-won humility returns. A post-hoc fix needs its own clean held-out data to learn from and to be re-checked against; scikit-learn notes that isotonic calibration only behaves above roughly a thousand samples, or it simply overfits the noise. And calibration drifts as the world drifts. The camera changes, the lighting changes, a new product line arrives, and the diagonal you earned last quarter quietly bends. The reliability diagram is not a certificate you frame on the wall. It is a gauge you keep reading, for as long as the model is making decisions that matter.
That is the turn that takes this out of the seminar room. When a model’s confidence gates a real decision, which weld to re-inspect, which scan to escalate, which label to wave through without a human ever looking, an uncalibrated ninety-nine per cent is not a small inaccuracy. It is a lie with a number attached, and the cost of believing it is paid downstream, by whoever trusted it.
The forecaster earns the right to say seventy per cent by being wrong on thirty per cent of those days, every time, on purpose. That is not the weakness of her craft. It is the proof that the number means something.
Our models should aspire to the same modest honesty. Not to be certain. To be right about how unsure they are, and to show you the diagram that proves it.
A good forecast is often wrong. An honest model knows by exactly how much.
Frequently asked questions
What is model calibration?
Model calibration, or confidence calibration, means a model's confidence scores match how often it is actually right. Among the cases it scores at seventy per cent, roughly seventy per cent should be correct. You check it with a reliability diagram and summarise the gap with Expected Calibration Error.
Why are modern neural networks often overconfident?
Because the very choices that raise accuracy tend to hurt calibration. Greater depth and width, batch normalisation and lighter weight decay all lower the error rate while pushing confidence above accuracy. A network can become the better classifier and the worse witness, asserting ninety-nine per cent where it has no right to.
How do you fix an overconfident model?
A post-hoc method called temperature scaling is often enough: it divides the outputs by one learned number, leaves accuracy untouched, and can cut Expected Calibration Error sharply. It needs its own clean held-out data, and calibration drifts as cameras, lighting and product lines change, so you keep re-checking the reliability diagram.
Can AI replace a qualified inspector?
No. A calibrated model is a screening and review layer, not a replacement for judgement. It ranks work by uncertainty and shows where confidence is thin, so a qualified inspector spends attention on the doubtful cases and signs off the decisions that matter. The human stays in the loop.
How much labelled data do you need to start?
None to begin. VisionEngine labels every image with an open-vocabulary baseline before any training, so you start from model suggestions rather than a blank set. You then review a small number of uncertainty-flagged labels, accept, reject or fix them, train, and add more images to repeat the loop.